Burndown Chart

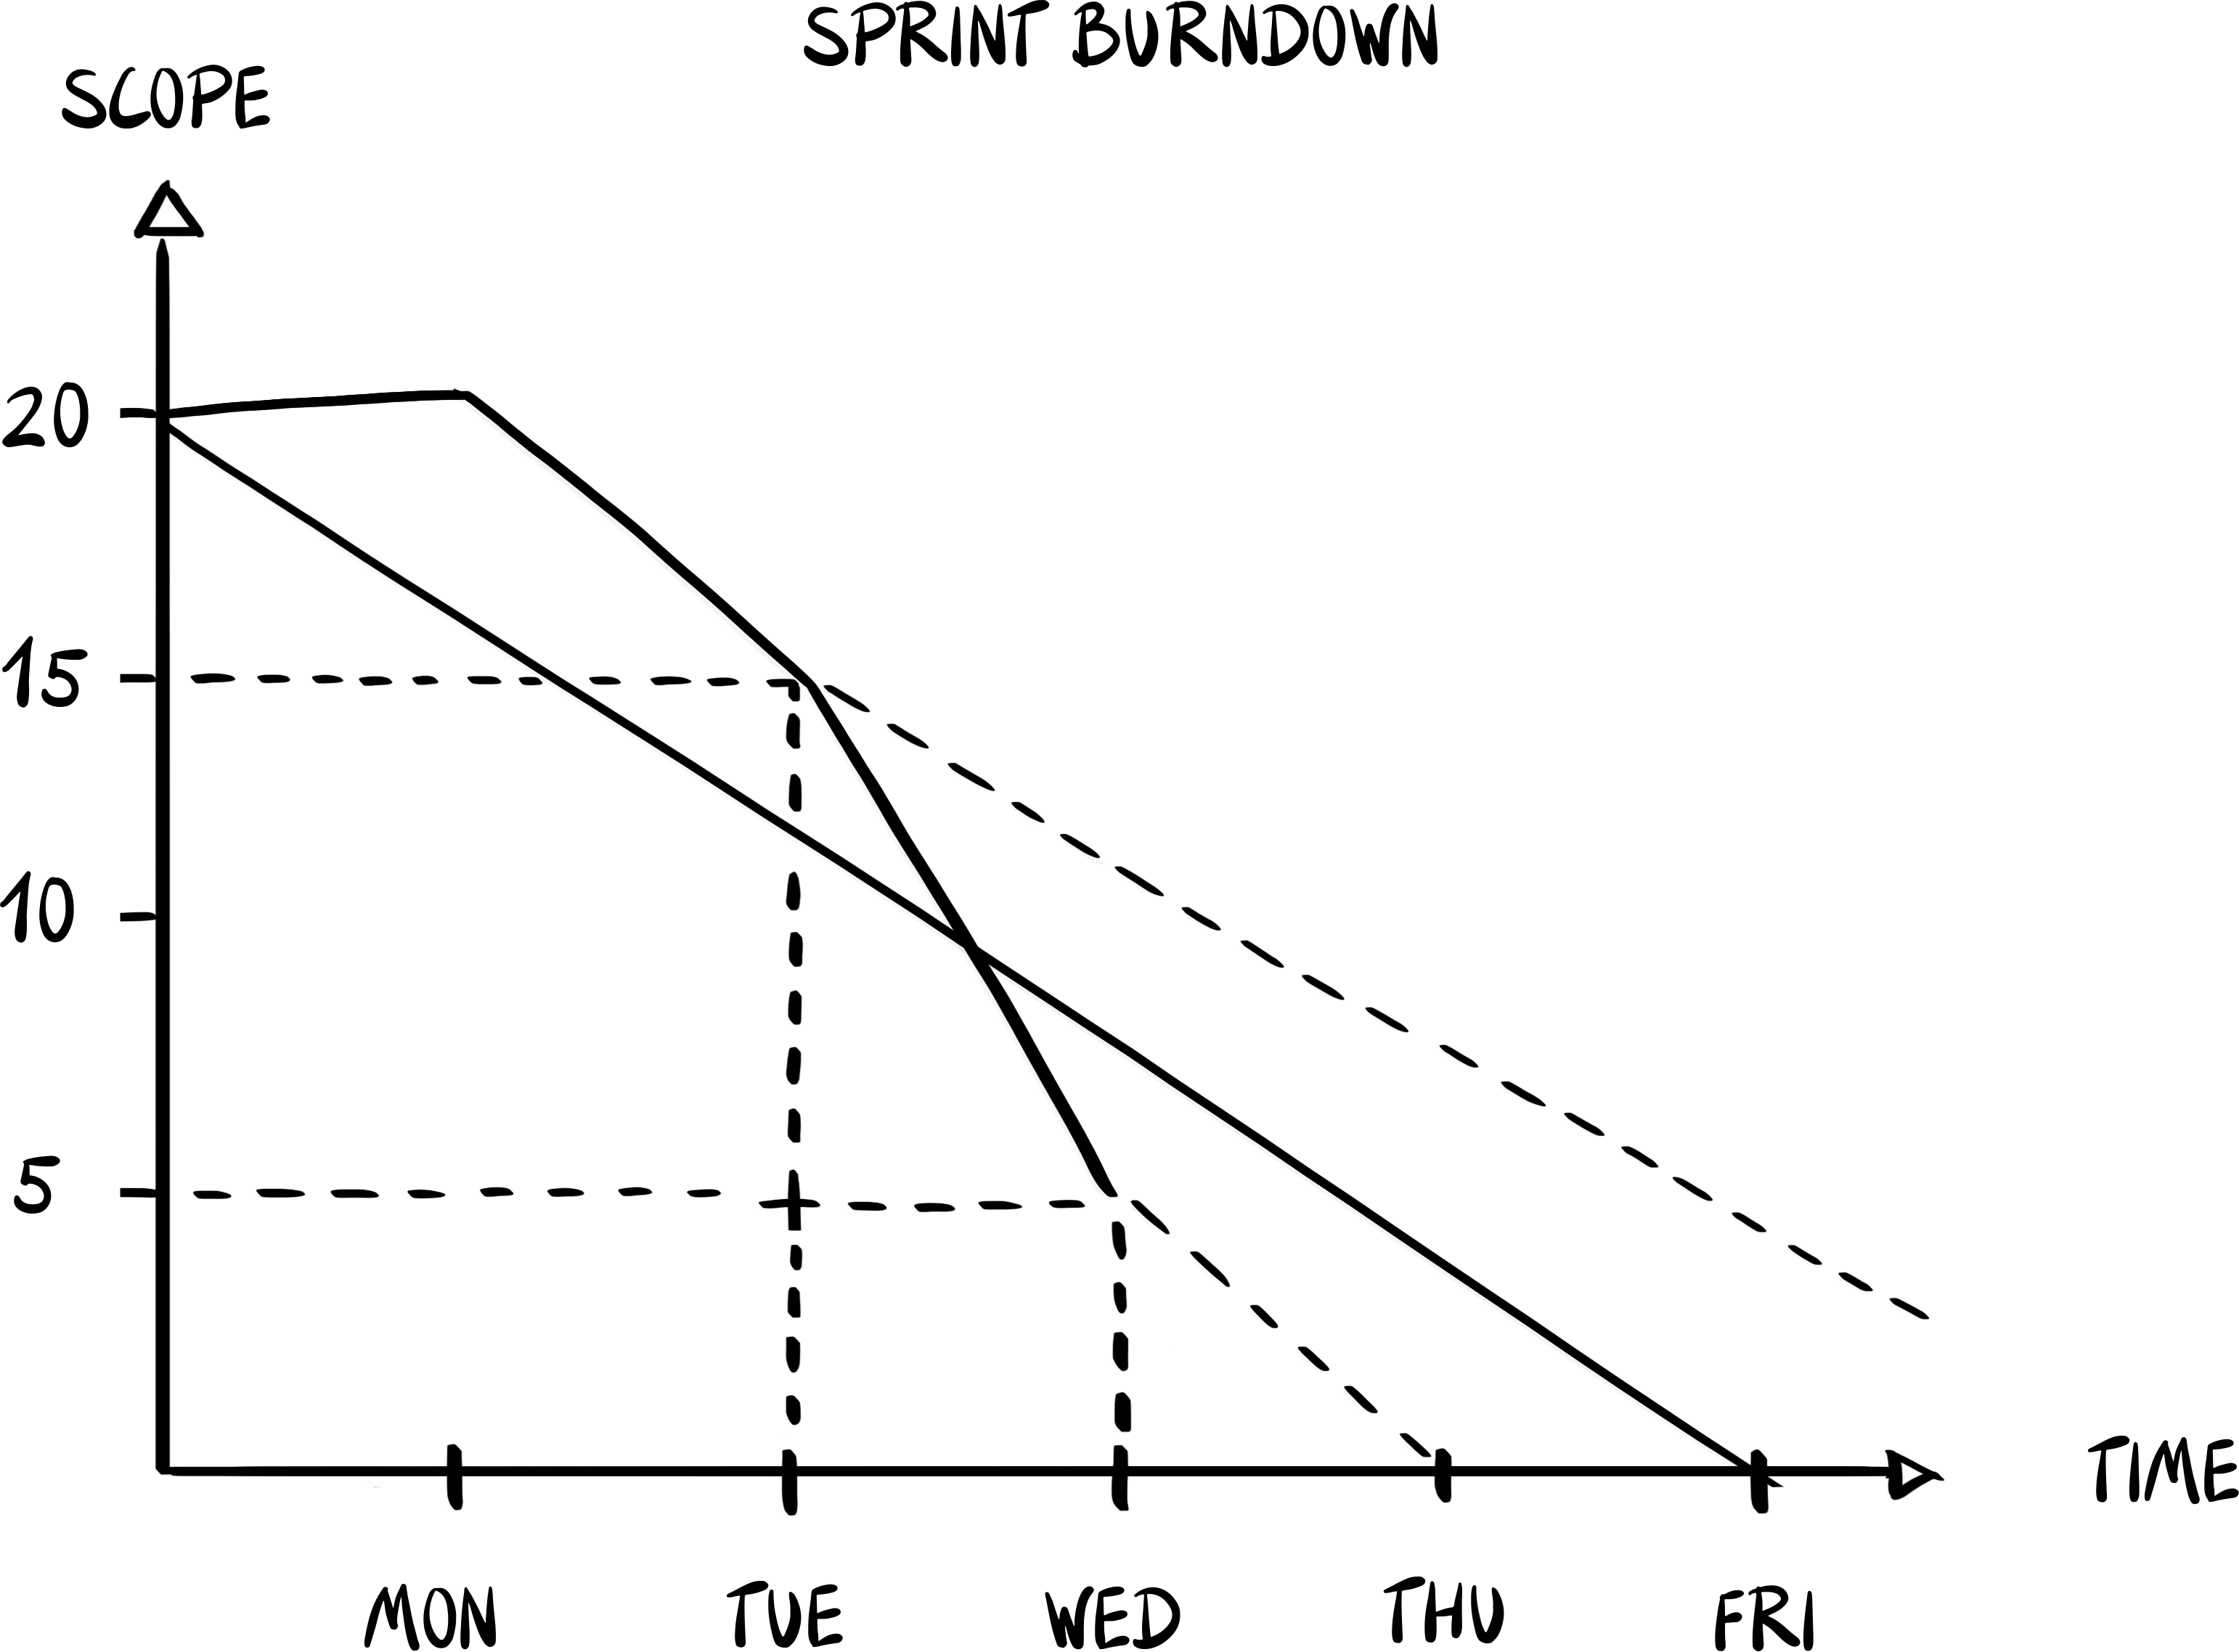
A burndown chart is a visual tool used to track the progress of work completed against the total work planned for a sprint or a product. It's essentially a graph that shows how quickly the team is "burning down" the amount of work, represented by effort estimates (like story points or hours), over time. The X-axis typically represents time (days of the sprint), and the Y-axis represents the remaining work at the start of the period. As the team completes product backlog items, the chart trends downwards towards zero, indicating progress.
Burndown charts are grounded in empirical process control, which emphasizes transparency, inspection, and adaptation. By visually tracking completed work and comparing it to the planned work, teams can empirically assess their progress and make data-driven decisions. This approach allows for adjustments to be made faster,, ensuring the team can adapt their work plan to meet sprint goals effectively.
Questions Answered by a Burndown Chart:
How much work will be completed by a certain date?
By observing the current downward trend, teams can predict which backlog items will likely be completed within the sprint.
How long will it take to complete a specific amount of work?
By analyzing the average completion rate or looking at past sprints with the highest and lowest completion rates, teams can estimate best, worst, and average case scenarios for completing the remaining work.
Benefits of Using a Burndown Chart:
Transparency: Provides a clear, visual representation of the team's progress towards sprint goals, accessible to all team members and stakeholders.
Inspection and Adaptation: Helps the team inspect their progress and workload regularly, allowing for timely adaptations to stay on track.
Predictability: Enhances the team's ability to predict how much work can be completed by the end of the sprint or project, based on empirical evidence from the chart's trends.
In summary, burndown charts serve as a tool in the Agile toolkit, enabling teams to visually monitor their progress and make informed decisions to ensure the successful completion of sprint goals. By relying on empirical data, teams can better manage their workloads, anticipate challenges, and adjust their strategies to maintain productivity and meet deadlines.